Intro to R & Data Science
Intro to R & Data Science
Learning Outcomes
- Understand Data Science as the context for this course
- Understand R in the context of data science.
What is Data Science?
-
Coined in 2001, “Data science is a discipline that incorporates varying degrees of Data Engineering, Scientific Method, Math, Statistics, Advanced Computing, Visualization, Hacker mindset, and Domain Expertise.” William S Cleveland1
-
“Data science, or data-driven science, combines different fields of work in statistics and computation to interpret data for decision-making purposes.” Caroline Banton2
-
“Data science is a multi-disciplinary field that uses scientific methods, processes, algorithms and systems to extract knowledge and insights from structured and unstructured data.”
-
“Data Scientist: The Sexiest Job of the 21st Century” THDJ Patil and T Davenport3
Components of Data Science
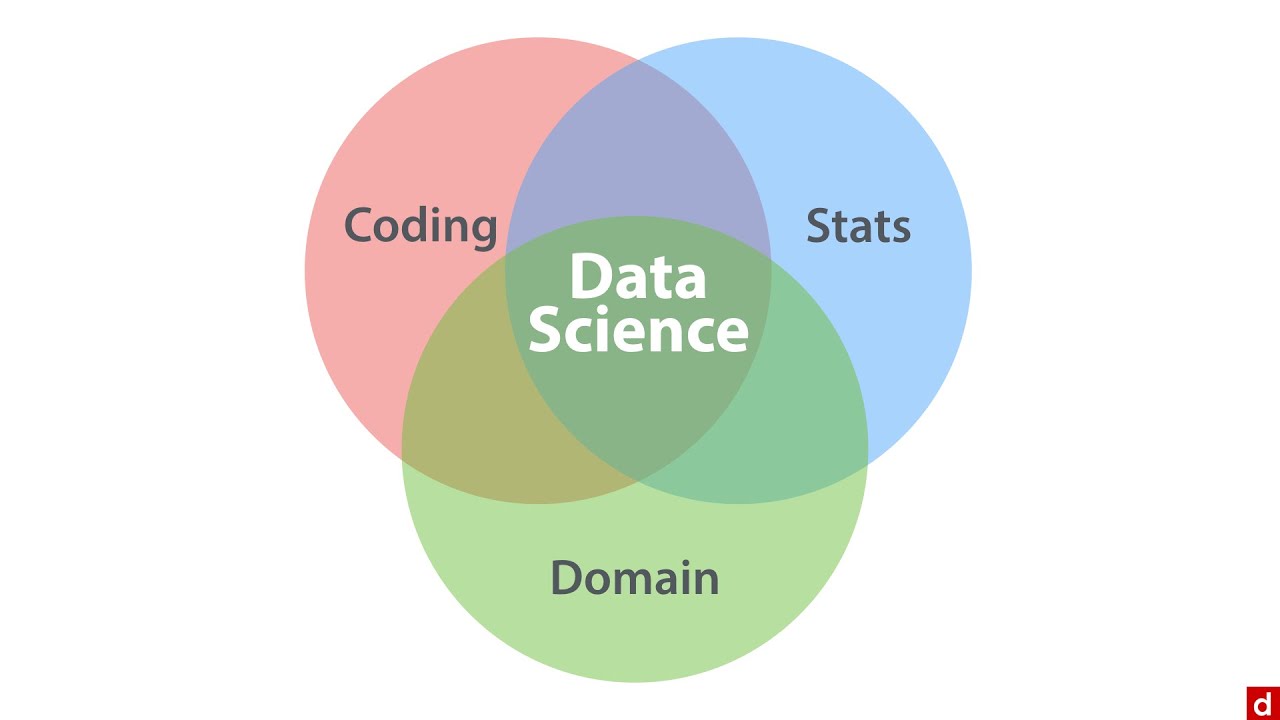
- Statistics
- Domain Knowledge
- Computation
Statistics
- Inferring general properties given data.
- Causal inference.
- Modeling (descriptive and predictive).
- Quantifying uncertainty.
- STAT 514, Statistical Methods, STAT 615 (Regression), STAT 627 (Machine Learning),
- Most of the STAT curriculum is applicable.
Domain Knowledge
- Expertise in an area of application
- e.g., biology, psychology, economics, chemistry, etc..
- Allows you to understand data in context of the area and/or decision to be made.
- Lets you ask interesting questions.
- Lets you spot problems with existing analysis pipelines.
- Various “Tracks” in the data science program.
Computation – This class
- Data import
- Data preparation
- Data exploration
- Data transformation
- Data visualization
- STAT 612 (R programming), STAT 613 (Data Science), most of the CS curriculum.
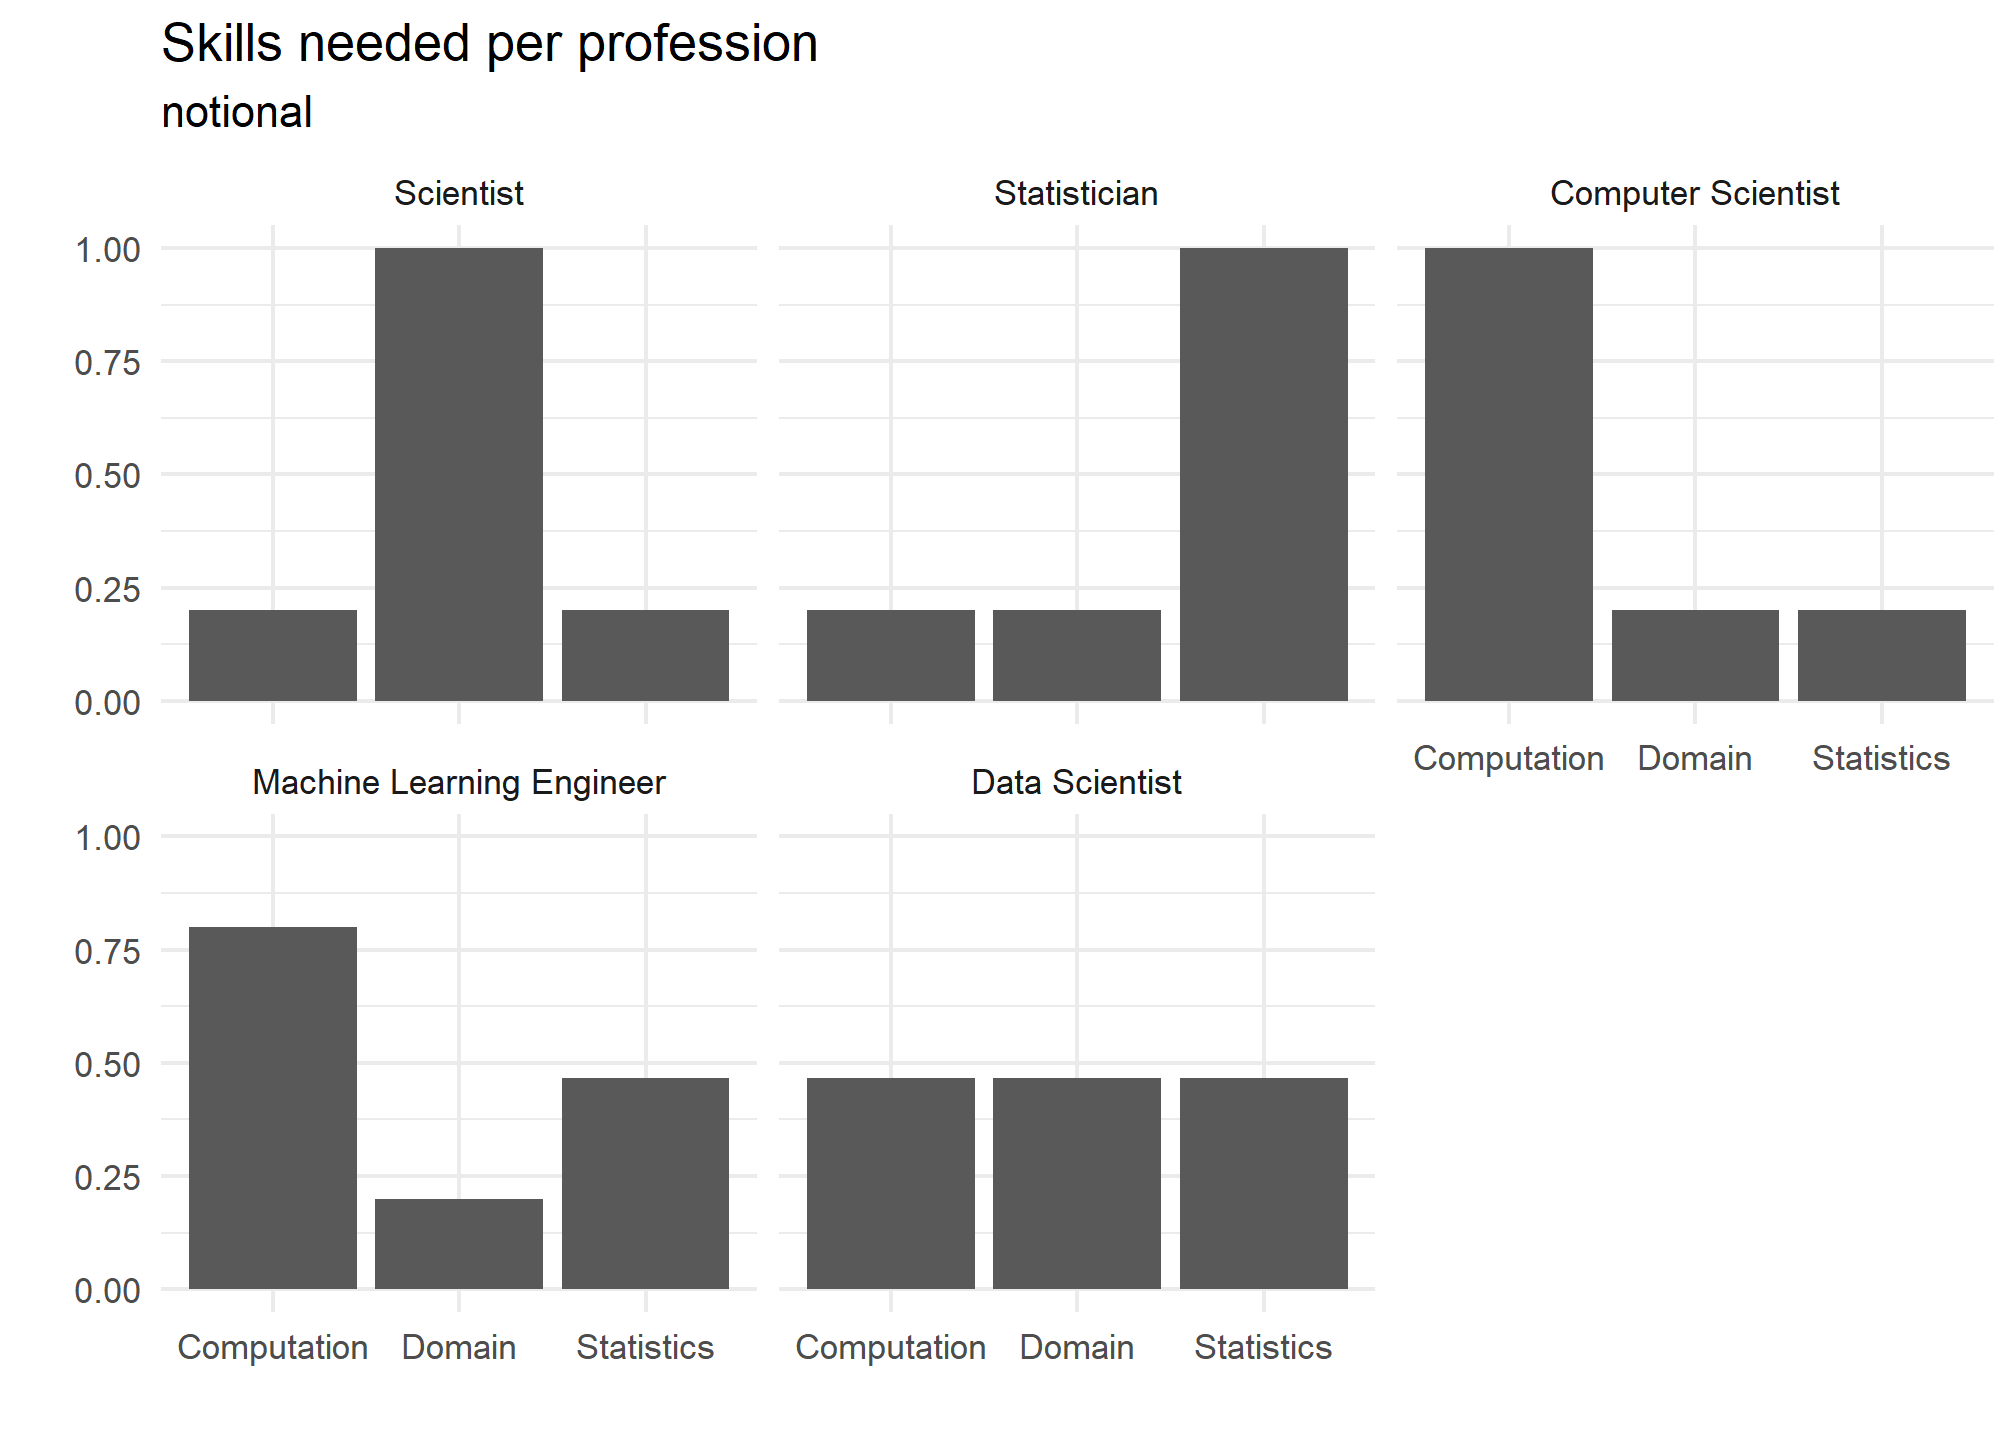
Various Professions
What makes a data scientist?
- People in diverse professions use these three skills to analyze data.
- Professions often differ by their level of expertise or interest in each skill.
- Data Science projects usually a “team activity”
Introductions
-
We’ll be doing group projects and you should form your groups of 2-4 people early in the semester.
-
Let’s take a break to introduce ourselves. Turn on your cameras and say Hi and one or two sentences about yourself and your goals for the course.
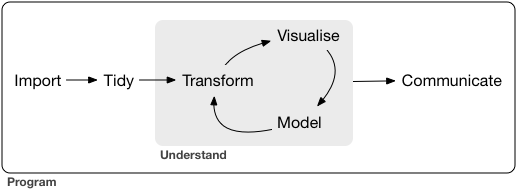
The Steps of an Analysis and R
Steps of a data analysis
- Before you start your data analysis and R
- Something is happening in the world
- Someone collects data
- Someone asks a question
- R Time
Tools
- Many tools exist for these steps:
- General data tools: R, Python, Julia, Matlab, STATA, SAS
- Other tools: SQL (data import), git (version control), map/reduce software (for big data).
- Advantages and disadvantages to each.
R
- R is a statistical programming (or scripting) language.
- You write code (a series of functions) to perform some task.
- R can be used to perform all of the tasks of a data analysis.
- R is built around the idea of packages: like apps
- Packages are sets of functions designed to work together to accomplish a specific set of tasks
- There are thousands of packages and you can install any one with a simple function
install_packages()
Motivation for R
- It’s free and open source.
- You will always have access to R.
- Not true for other software (Matlab, STATA, SAS).
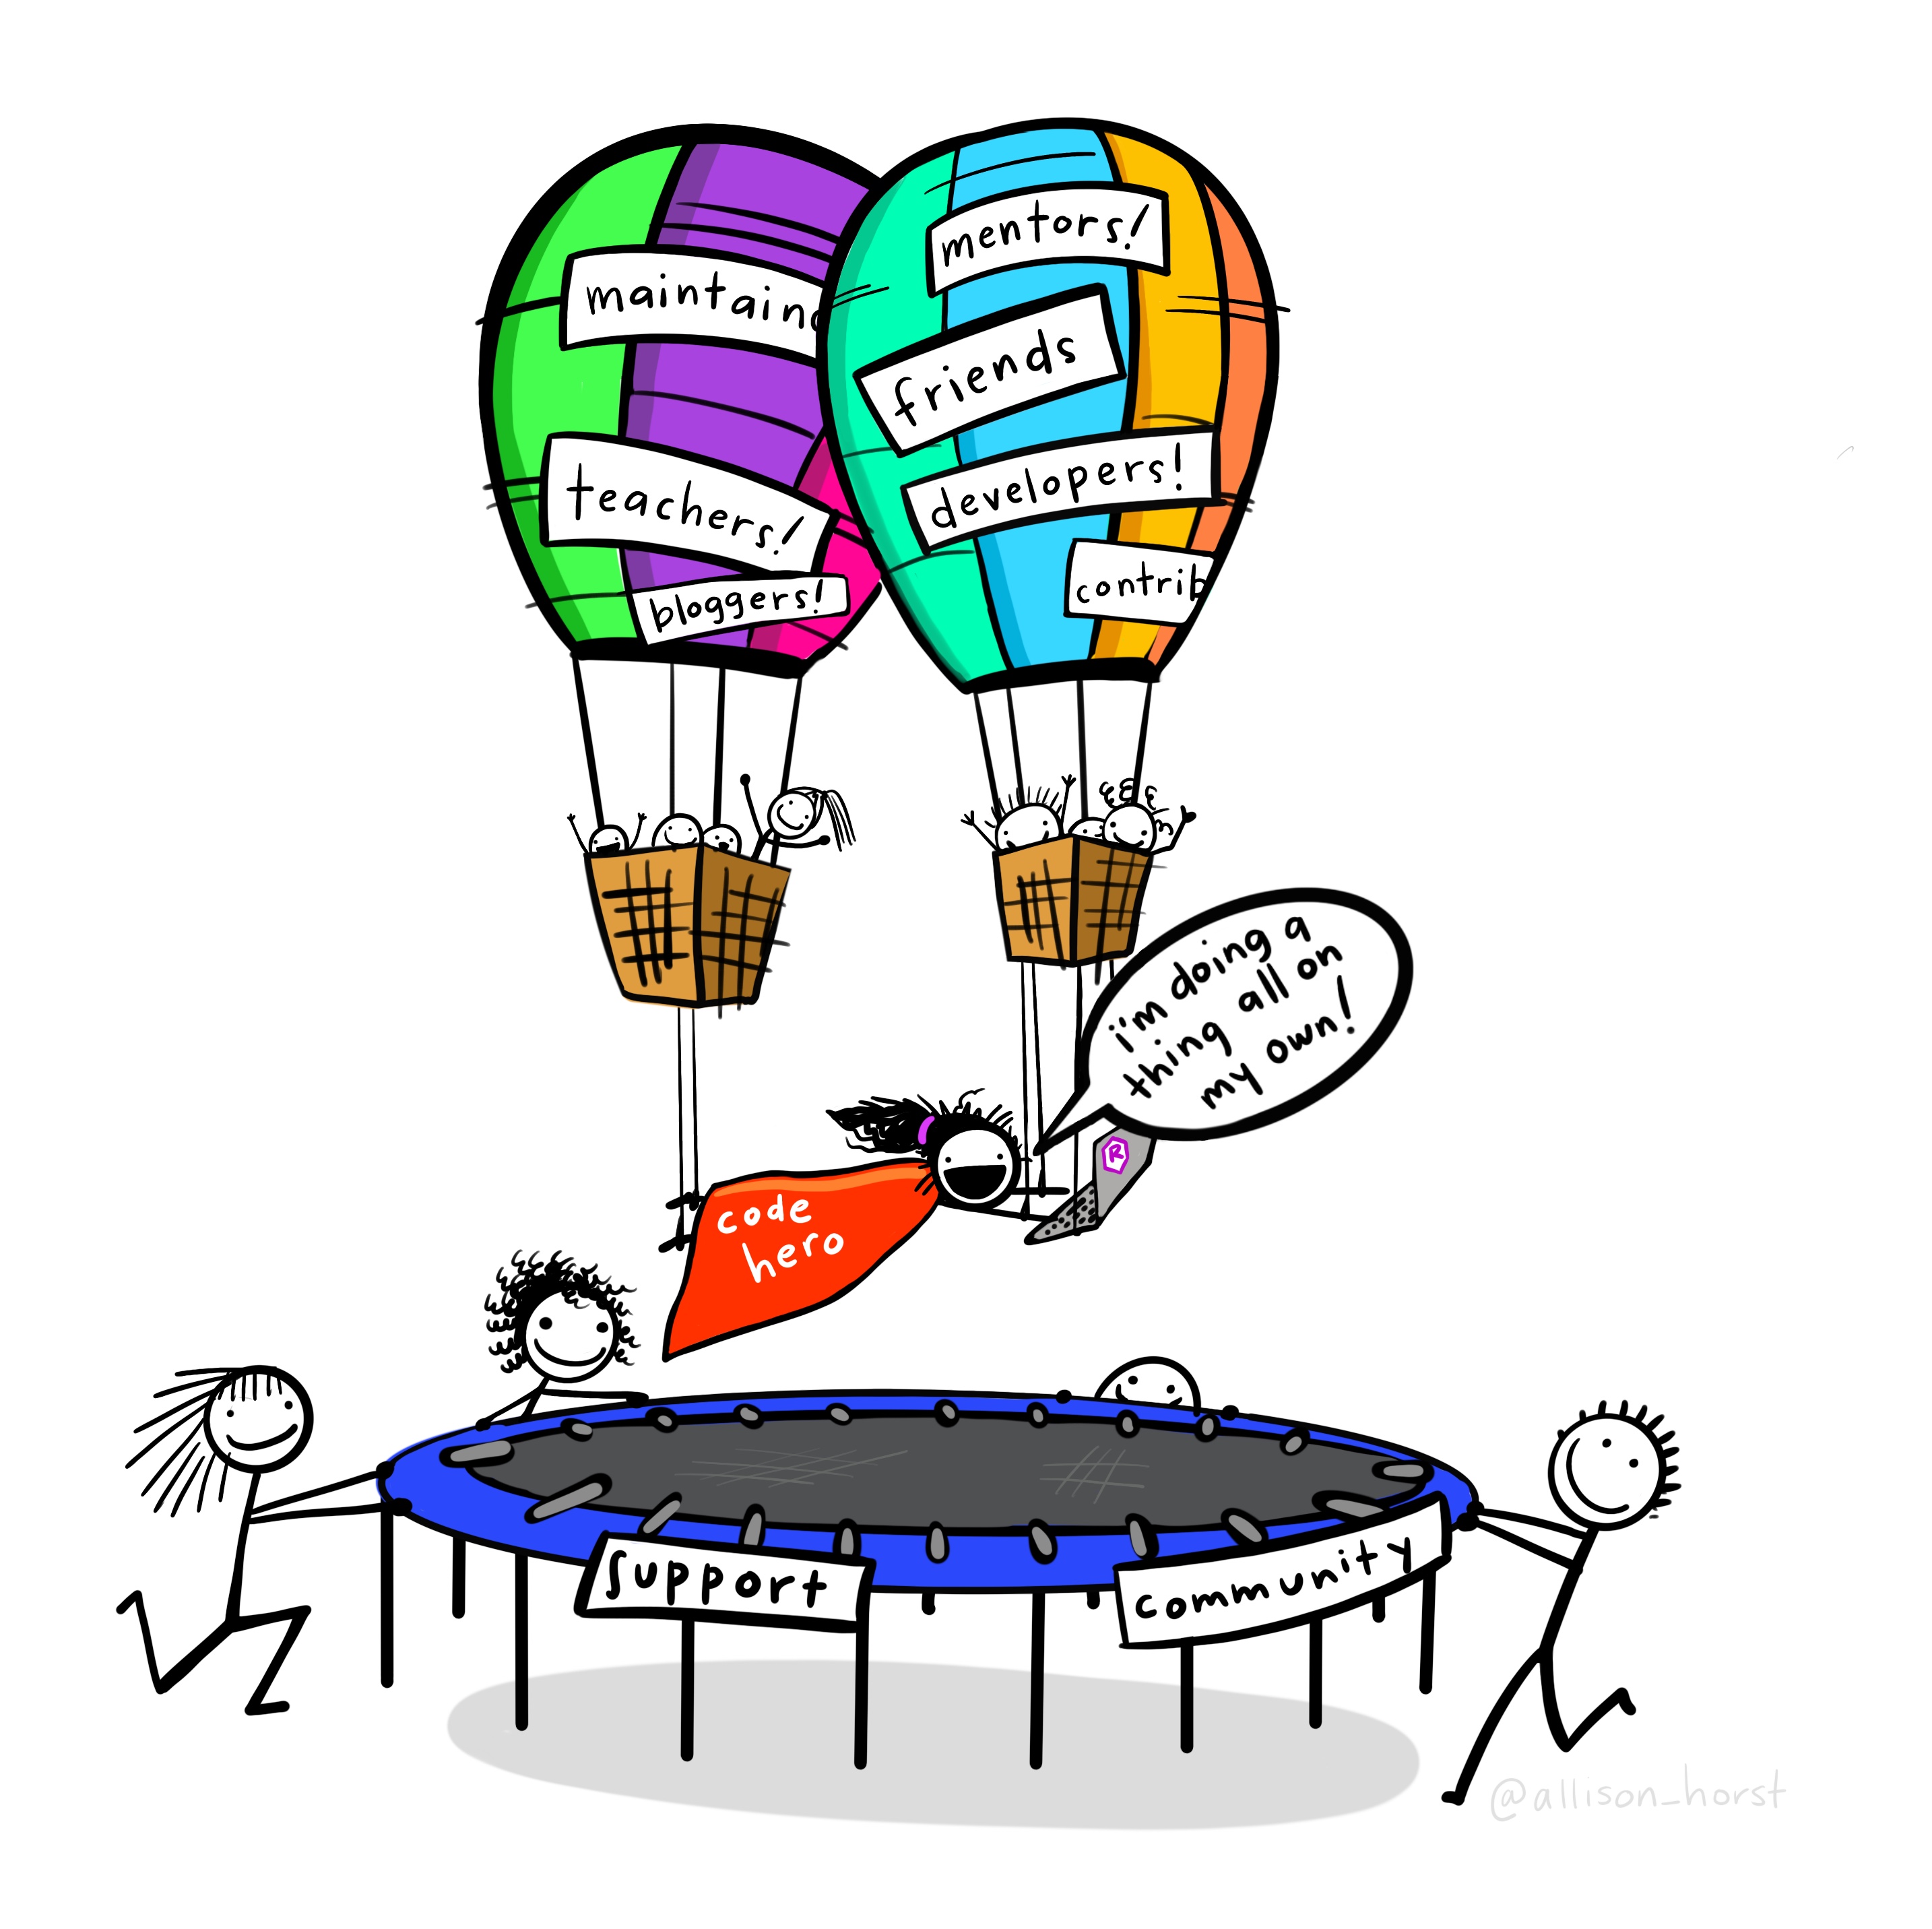
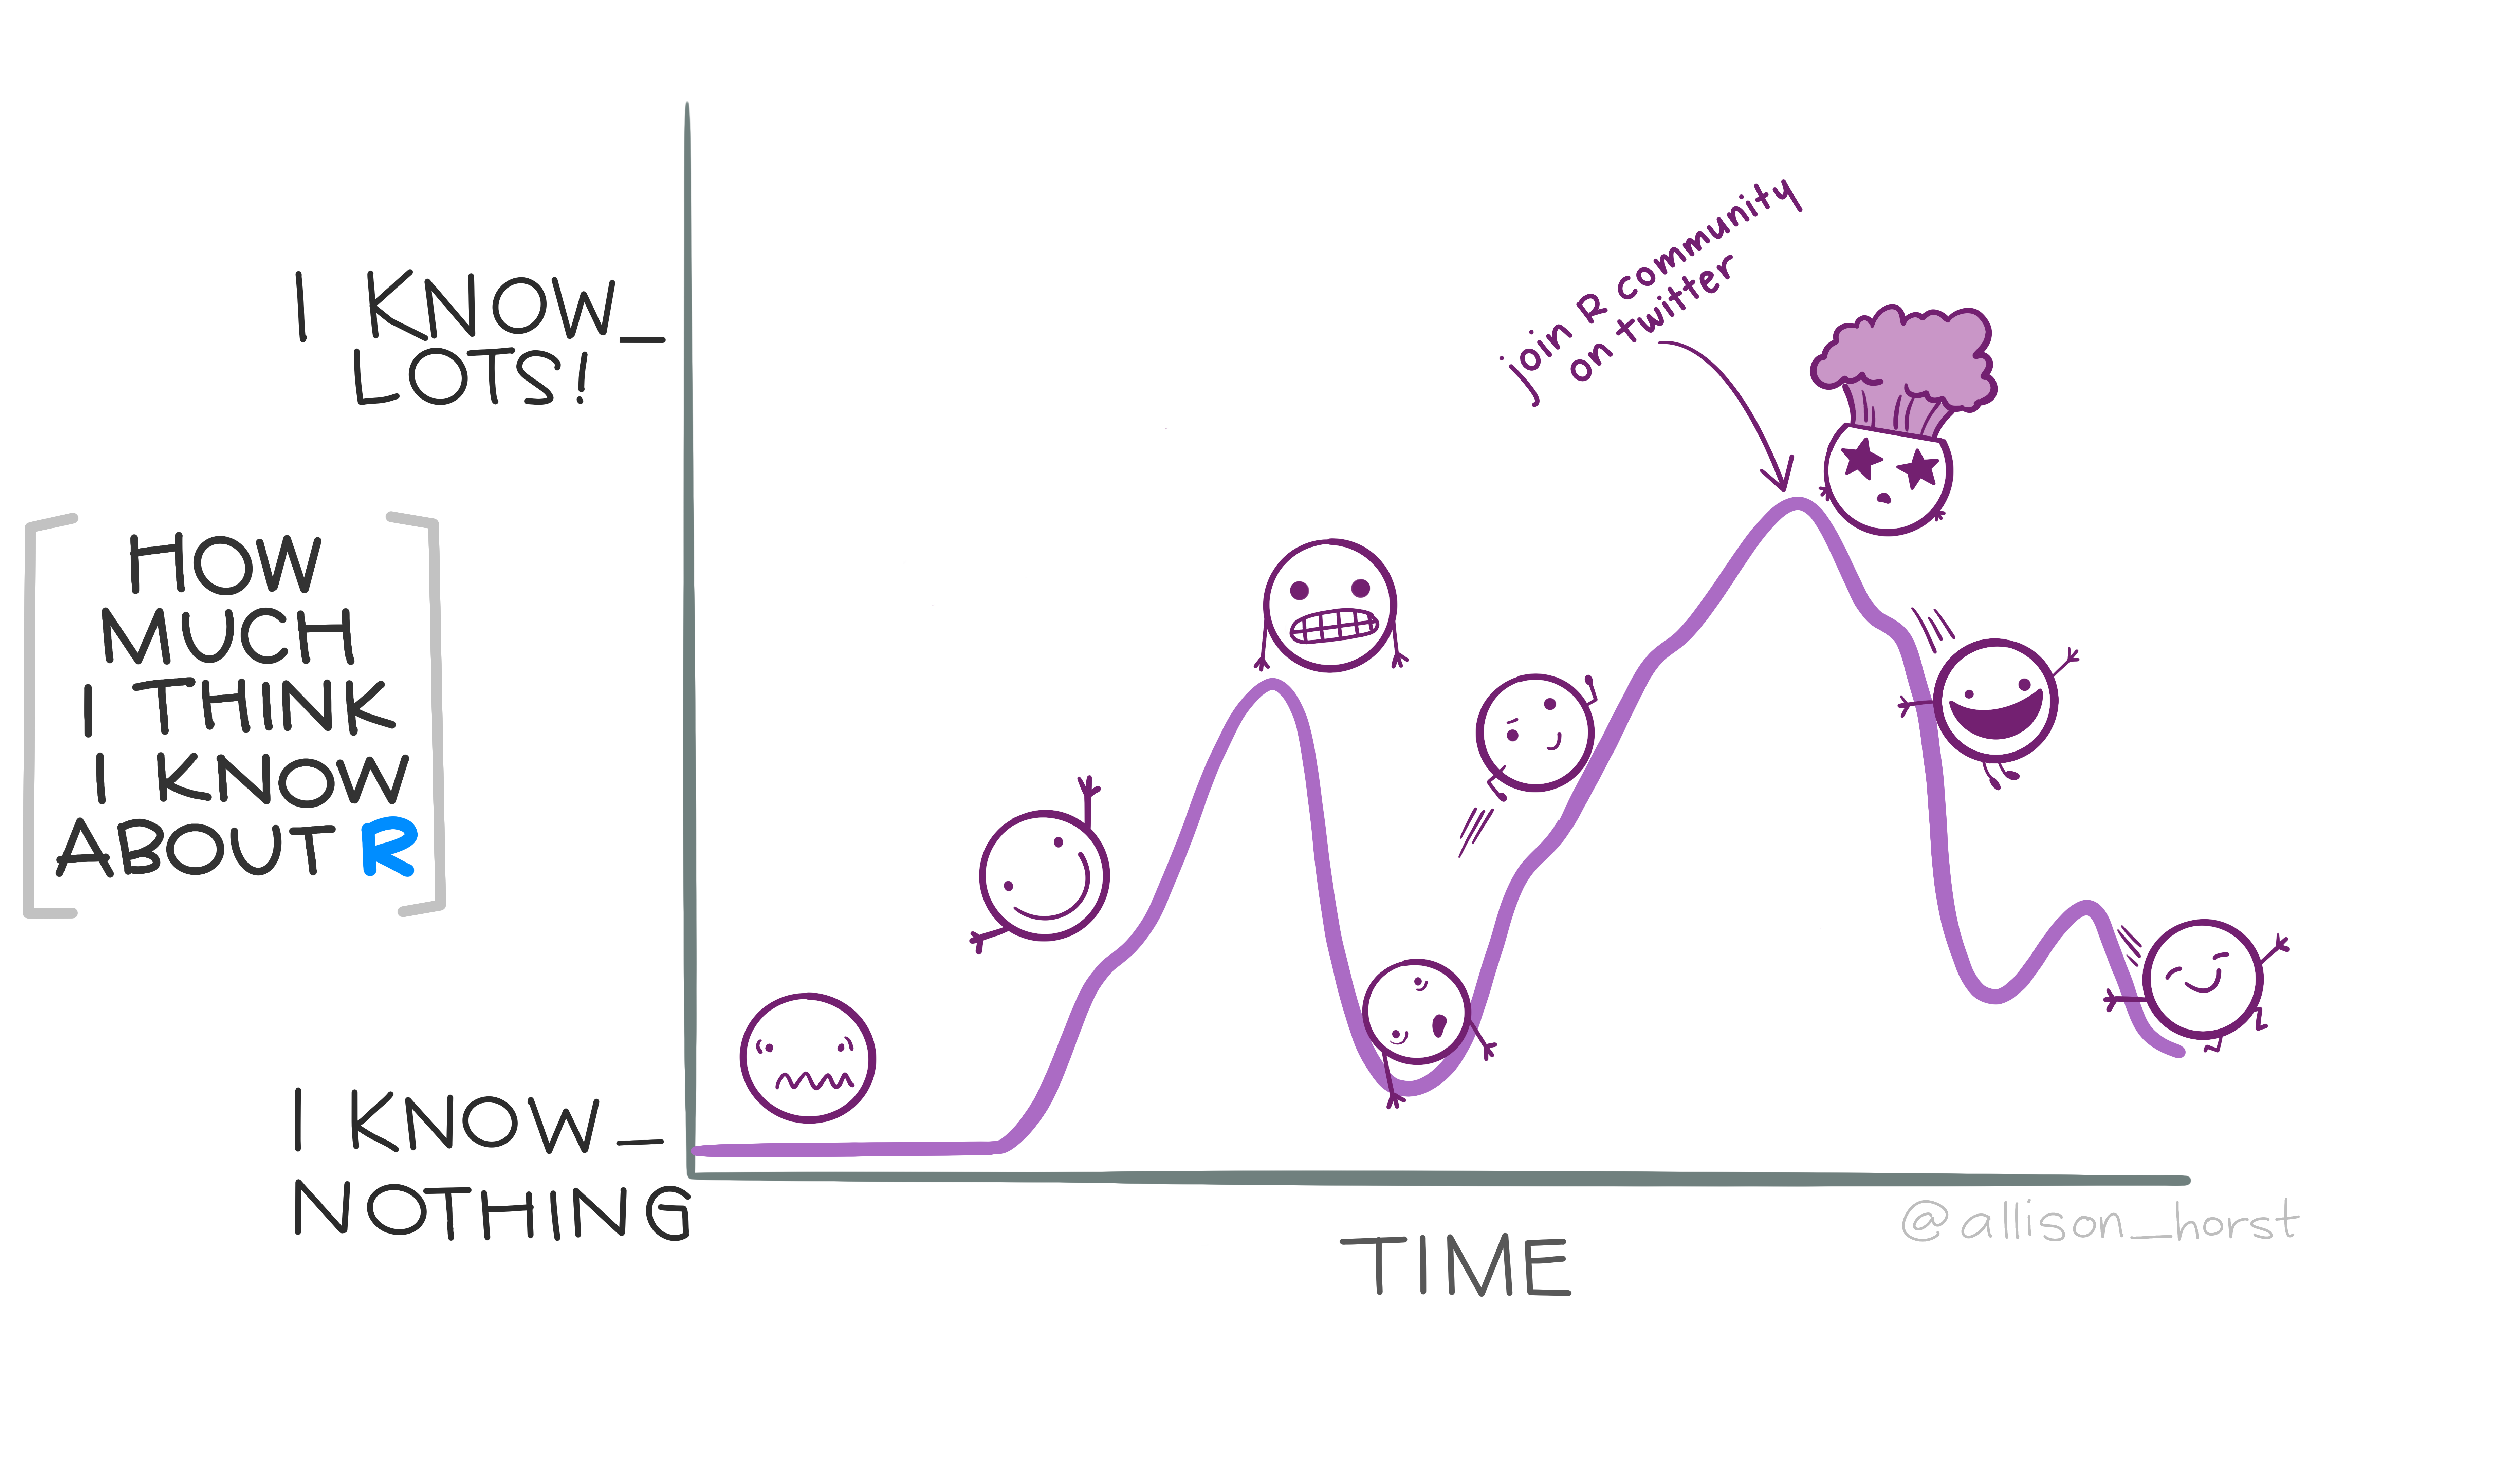
- It’s widely used with a lot of community support.
- If you need some special analysis, someone has often made an R package.
- It’s relatively easy (especially graphics and data wrangling).
- “Evolution” driven by statisticians for local utility more than enterprise software
- It enables reproducible research and analysis
- Copying and pasting across spreadsheets can lead to mistakes - see Thomas Herndon, Michael Ash, and Robert Pollin4
- In R, you can essentially automate your analysis, reducing the chance for mistakes and making your analysis transparent to the wider research community as well as reproducible.
What about Python??
- Python is also a very good language for data science.
- As a more general computer language it can be used for developing broader applications.
- Computer scientists tend to prefer it because its design and syntax is more like a standard computer language.
- Can make it harder to learn for a non-programmer.
- Main reason to use either tool is based on the use case and your collaborators.
Two main flavors of R Users
-
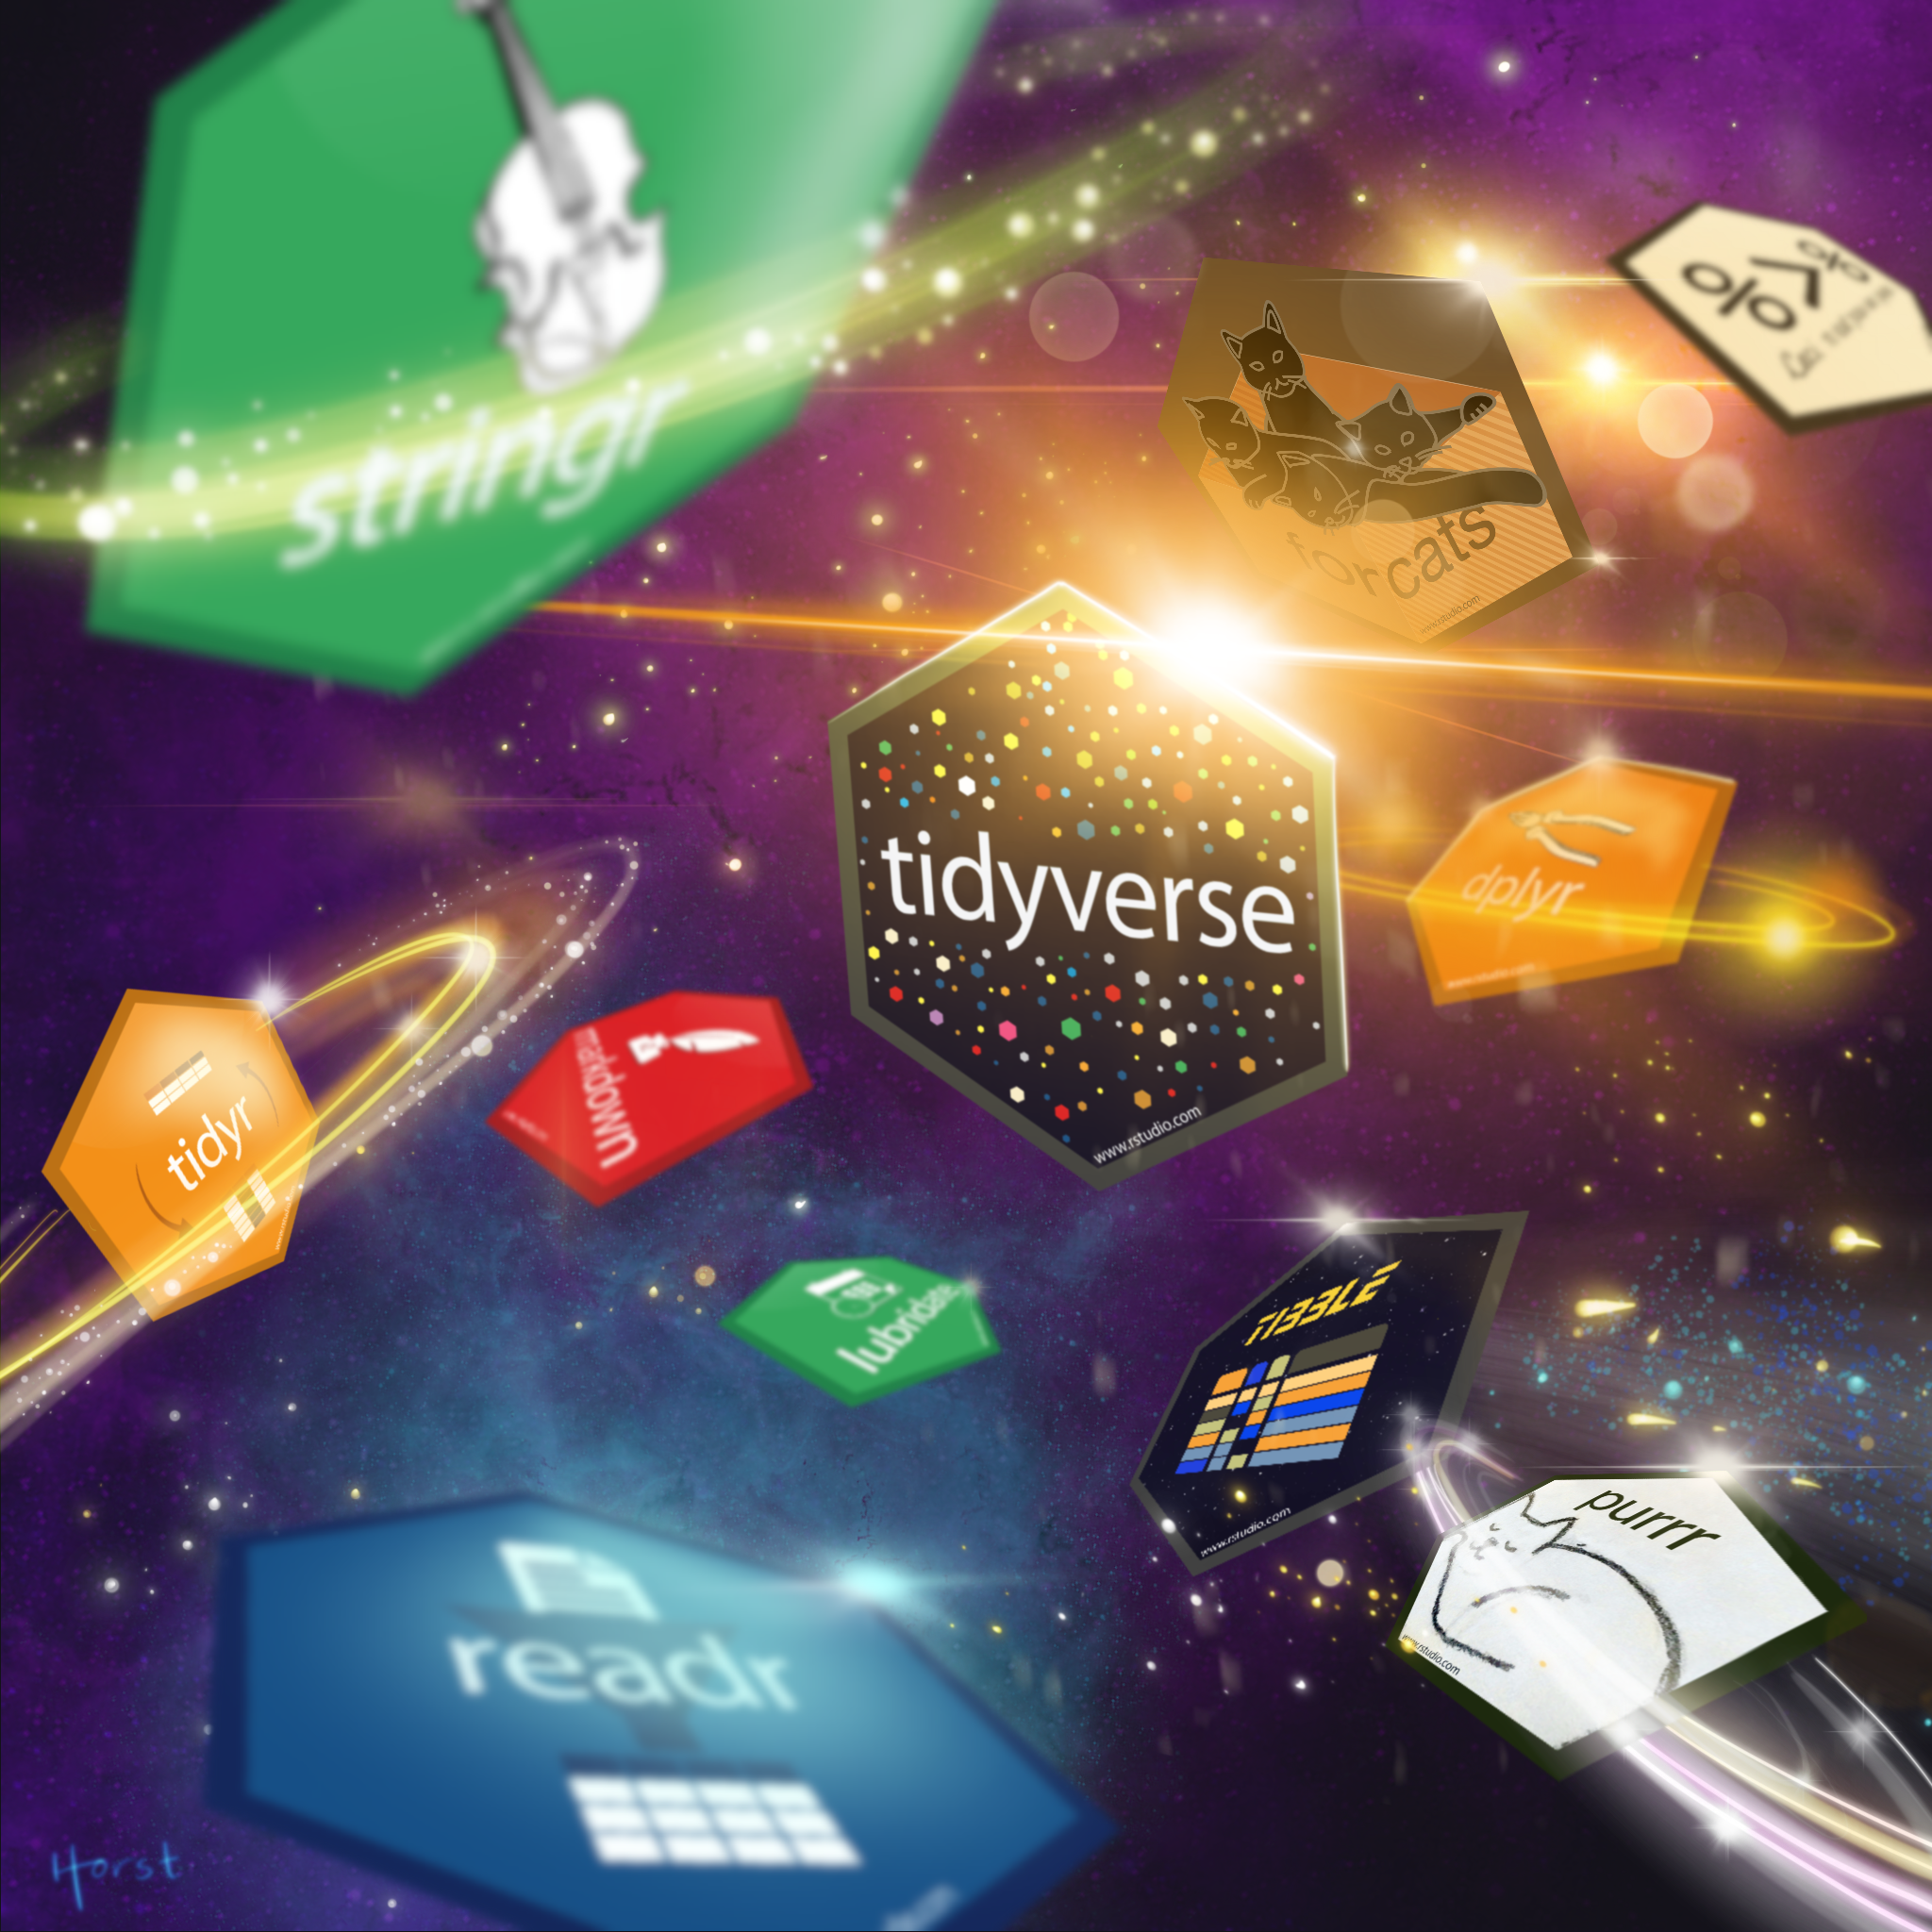
There are two main flavors of R programmers: Base R users and tidyverse users.
-
Base R is the default system - it’s more general but not as intuitive or consistent as the tidyverse.
-
tidyverse packages are much more convenient for the vast majority of tasks, as long as you drink the Koolaid.
- They are not always the fastest but for many many uses and data sets they provide a convenient framework
This Class - See the Syllabus
Learning Outcomes
STAT 412/612 will Develop your competence, creativity, and confidence as a data scientist working with R so you can …
- Execute a regular process to execute reproducible research and analysis using R and R Studio and communicate the results and implications to others.
- Install and use R packages for specific applications
- Import data from a variety of external sources
- Use tidyverse capabilities to transform data to support analysis in R
- Use tidyverse graphical tools to visualize and understand data
- Write basic R functions using control and data structures
- Employ R functions to conduct statistical analysis and inference
- Generate research or analytical reports and presentations using R Markdown and basic LaTeX capabilities.
- Deliver an oral presentation describing your data science analysis to an audience .
Books and Resources:
- All material used in this course is free and online.
- R for Data Science: https://r4ds.had.co.nz/ Garrett Grolemund and Hadley Wickham5
- Tidyverse Style Guide: https://style.tidyverse.org/ H Wickham6
- RStudio Cheat Sheets: https://www.rstudio.com/resources/cheatsheets/
References
-
“Data Science: An Action Plan for Expanding the Technical Areas of the Field of Statistics,” International Statistical Review 69, no. 1 (2001): 21–26. ↩︎
-
“Inside Data Science and Its Applications,” Investopedia (Investopedia, August 2020), https://www.investopedia.com/terms/d/data-science.asp. ↩︎
-
“Data Scientist: The Sexiest Job of the 21st Century,” Harvard Business Review 90, no. 10 (2012): 70–76. ↩︎
-
“Does High Public Debt Consistently Stifle Economic Growth? A Critique of Reinhart and Rogoff,” Cambridge Journal of Economics 38, no. 2 (2014): 257–79. ↩︎
-
“R for Data Science,” 2018. ↩︎
-
“The Tidyverse Style Guide,” 2017. ↩︎