Lab 7
We’ll work more with the nycflights13 dataset here.
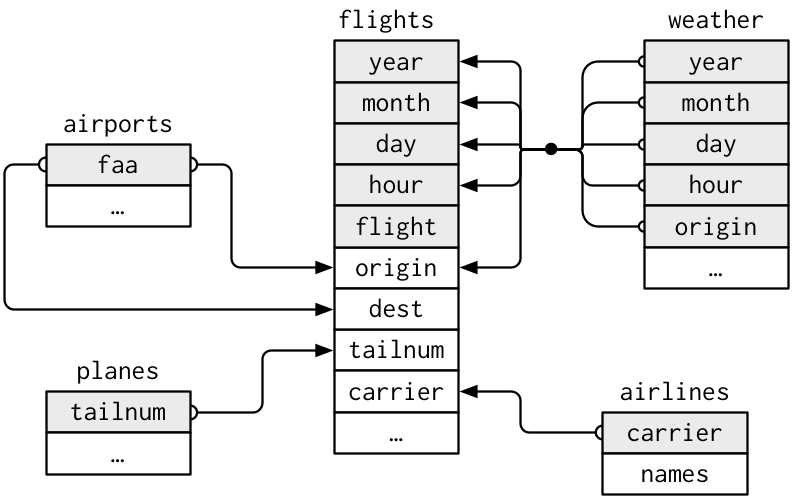
Here’s a plot of how the data is related to each other:
-
Load the nycflights13 and all five data frames into R.
-
How many different plane “brands” (i.e. manufacturers) fly from “LGA”?
-
Calculate the average age of each plane for each flight; How does the average age of each plane differ by origin airport?
-
How many airports are in the
airportsdata frame that are not a direct destination from any of the NYC airports (i.e. theflightsdataframe)? -
Calculate the number of tailnumbers (observations) per carrier. Arrange in alphabetical order by the full carrier name from the
airlinesdataframe. -
How many flights were made to an “America/Los_Angeles” timezone from “JFK”? Which destination within that timezone received the most flights from “JFK”?
-
For each flight, find if it departed with decent weather. Drop observations that we don’t have weather information or dep_delay information. See if decent weather is associated with the delay of the plane.
- Define “fair weather” to mean no precipitation, wind-speeds under 20 mph, and visibility of at least 10 miles.
flights %>%
  mutate(hour = dep_time %/% 100) %>%
  YOUDECIDE_join() %>%
  mutate() ... and so on
- Working with sets
- Create a table called “high_altitude” that contains the faa and full name of the aiport only altitudes above 5000.
- Create a second table called “low_arr_delay” and display the faa and full name of airports with an average arrival delay under 3.
- Which airlines are both high_altitude and low_arr_delay?
- Which airports are in low_arr_delay but not in high_altitude?
- Combine these two dataframes into one using a function we learned this week.