HW 1: Visualization and Markdown
For your first homework, you will practice using RMarkdown and ggplot2 on a dataset talking about animals and their sleep patterns.
Download the .Rmd template used for this homework here
Instructions
- After completing the questions in your .Rmd, knit and upload both the .RMD and PDF or HTML files to Canvas.
- Learning Outcomes
- Choose appropriate graphics for exploratory data analyses.
- Employ the ggplot2 system of visualization.
Hints
- For this homework, we will use the
msleepdataset from ggplot2. - Useful packages: ggplot2, ggthemes
- Some useful functions:
scale_fill_colorblind(),scale_y_log10(),facet_wrap(),scale_color_discrete(),geom_point(),ncol(),guides(),nrow(),ggplot(),geom_boxplot(),aes(),library(),data(),labs(),geom_smooth(),scale_x_log10(),theme_bw().
Grading Rubric {-}
| Question.Part: | Points | Topic |
|---|---|---|
| 1. | .50 | Loads packages and data |
| 2. | .50 | Identifies numbers of mammals and variables |
| 3.1 | .50 | Proper Question |
| 3.2 | .50 | Response Variable and type |
| 3.3 | .50 | Explanatory Variable and type |
| 3.4 | .50 | Correct Plot Type |
| 3.5 | 1.00 | Correct Plot with data |
| 3.6 | .50 | Interpretation |
| 4.1 | 3.00 | Three plots with transformed data |
| 4.2 | .50 | Correct Interpretation |
| 5.1 | 1.00 | Color Coding |
| 5.2 | .50 | Correct theme, labels and title |
| 6.1 | 1.00 | Correct OLS lines |
| 6.2 | .50 | Interpretation |
| 7.1 | 1.50 | Box Plot with correct data and colors |
| 7.2 | .50 | Correct scales |
| 7.3 | .50 | No legend and correct colors and theme |
| 8.1 | 2.00 | Plot with correct data and facets |
| 8.2 | .50 | Correct scales |
| 8.3 | .50 | Correct line color |
| 8.4 | .50 | Correct theme |
| EC.1 | .50 | Correct Overall OLS line |
| EC.2 | .50 | Interpretation |
| EC.3 | .50 | Correct Legend Title |
| Total | 17 | Plus 1.5 Optional Extra Credit |
Question 1
Load the tidyverse and ggthemes packages and the msleep data set.
Question 2
How many mammals are in the msleep data frame? How many variables? Use two R functions to get this information.
Question 3
You want to explore if total sleep time has a relationship with mammal body weight.
- Write out a question about the relationship
- What is your response variable and what type is it?
- What is your explanatory variable and what type is it?
- What is the appropriate type of plot given the types of variables?
- Create the appropriate plot with body weight against the total amount of sleep.
- Interpret the plot in one sentence: what does the shape tell you about the relationship?
Question 4
When you see a curved or skewed relationship in a plot, you can often get rid of the curve or skew by taking a log transformation of either the explanatory or the response variable or both.
- Create three plots: 1) ‘log(x)
, 2)log(y)and 3)log(x)andlog (y)`. - Which plot appears best (most linear) to you and why?
Question 5
Color code your preferred plot from question 4 by the diet of the animals (vore).
- Make the axis labels nice,
- Change the theme to your favorite theme_*(), and
- Add a meaningful title to the plot.
Question 6
Copy the plot from part 5 and add an OLS(“lm”) line (without standard errors) for each vore category.
Does the effect of body weight on sleep total appear larger for some diets?
Question 7
Reproduce the following plot:
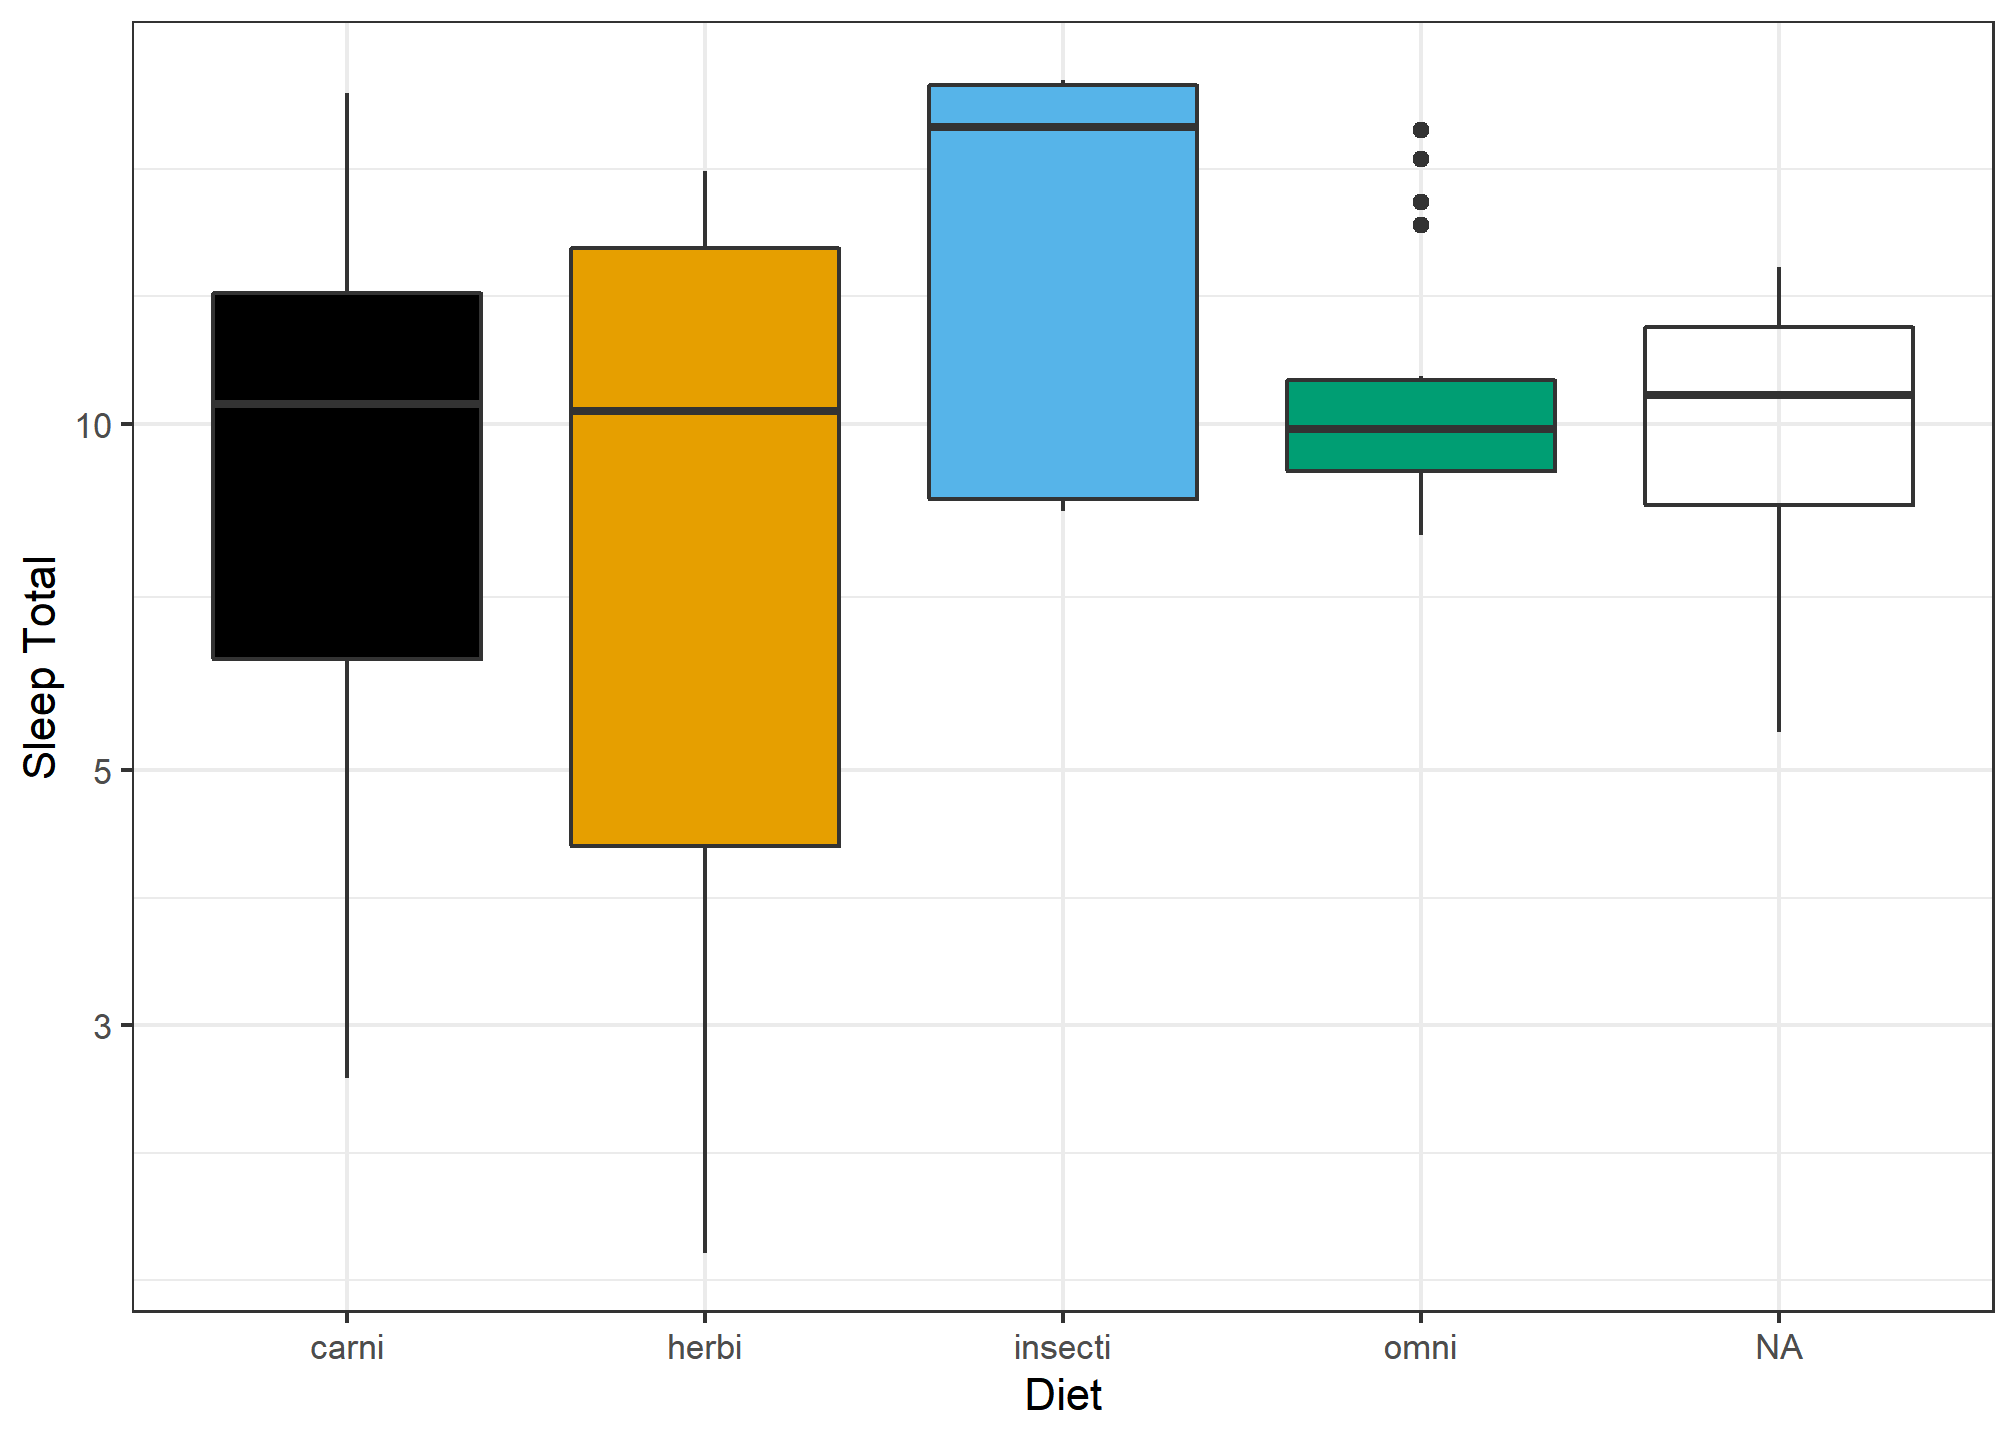
Note the following elements:
- the scale of the values of the y axis,
- the lack of a legend,
- the color scheme and the background.(hint: I used the colorblind safe palette)
Question 8
Reproduce the following plot:
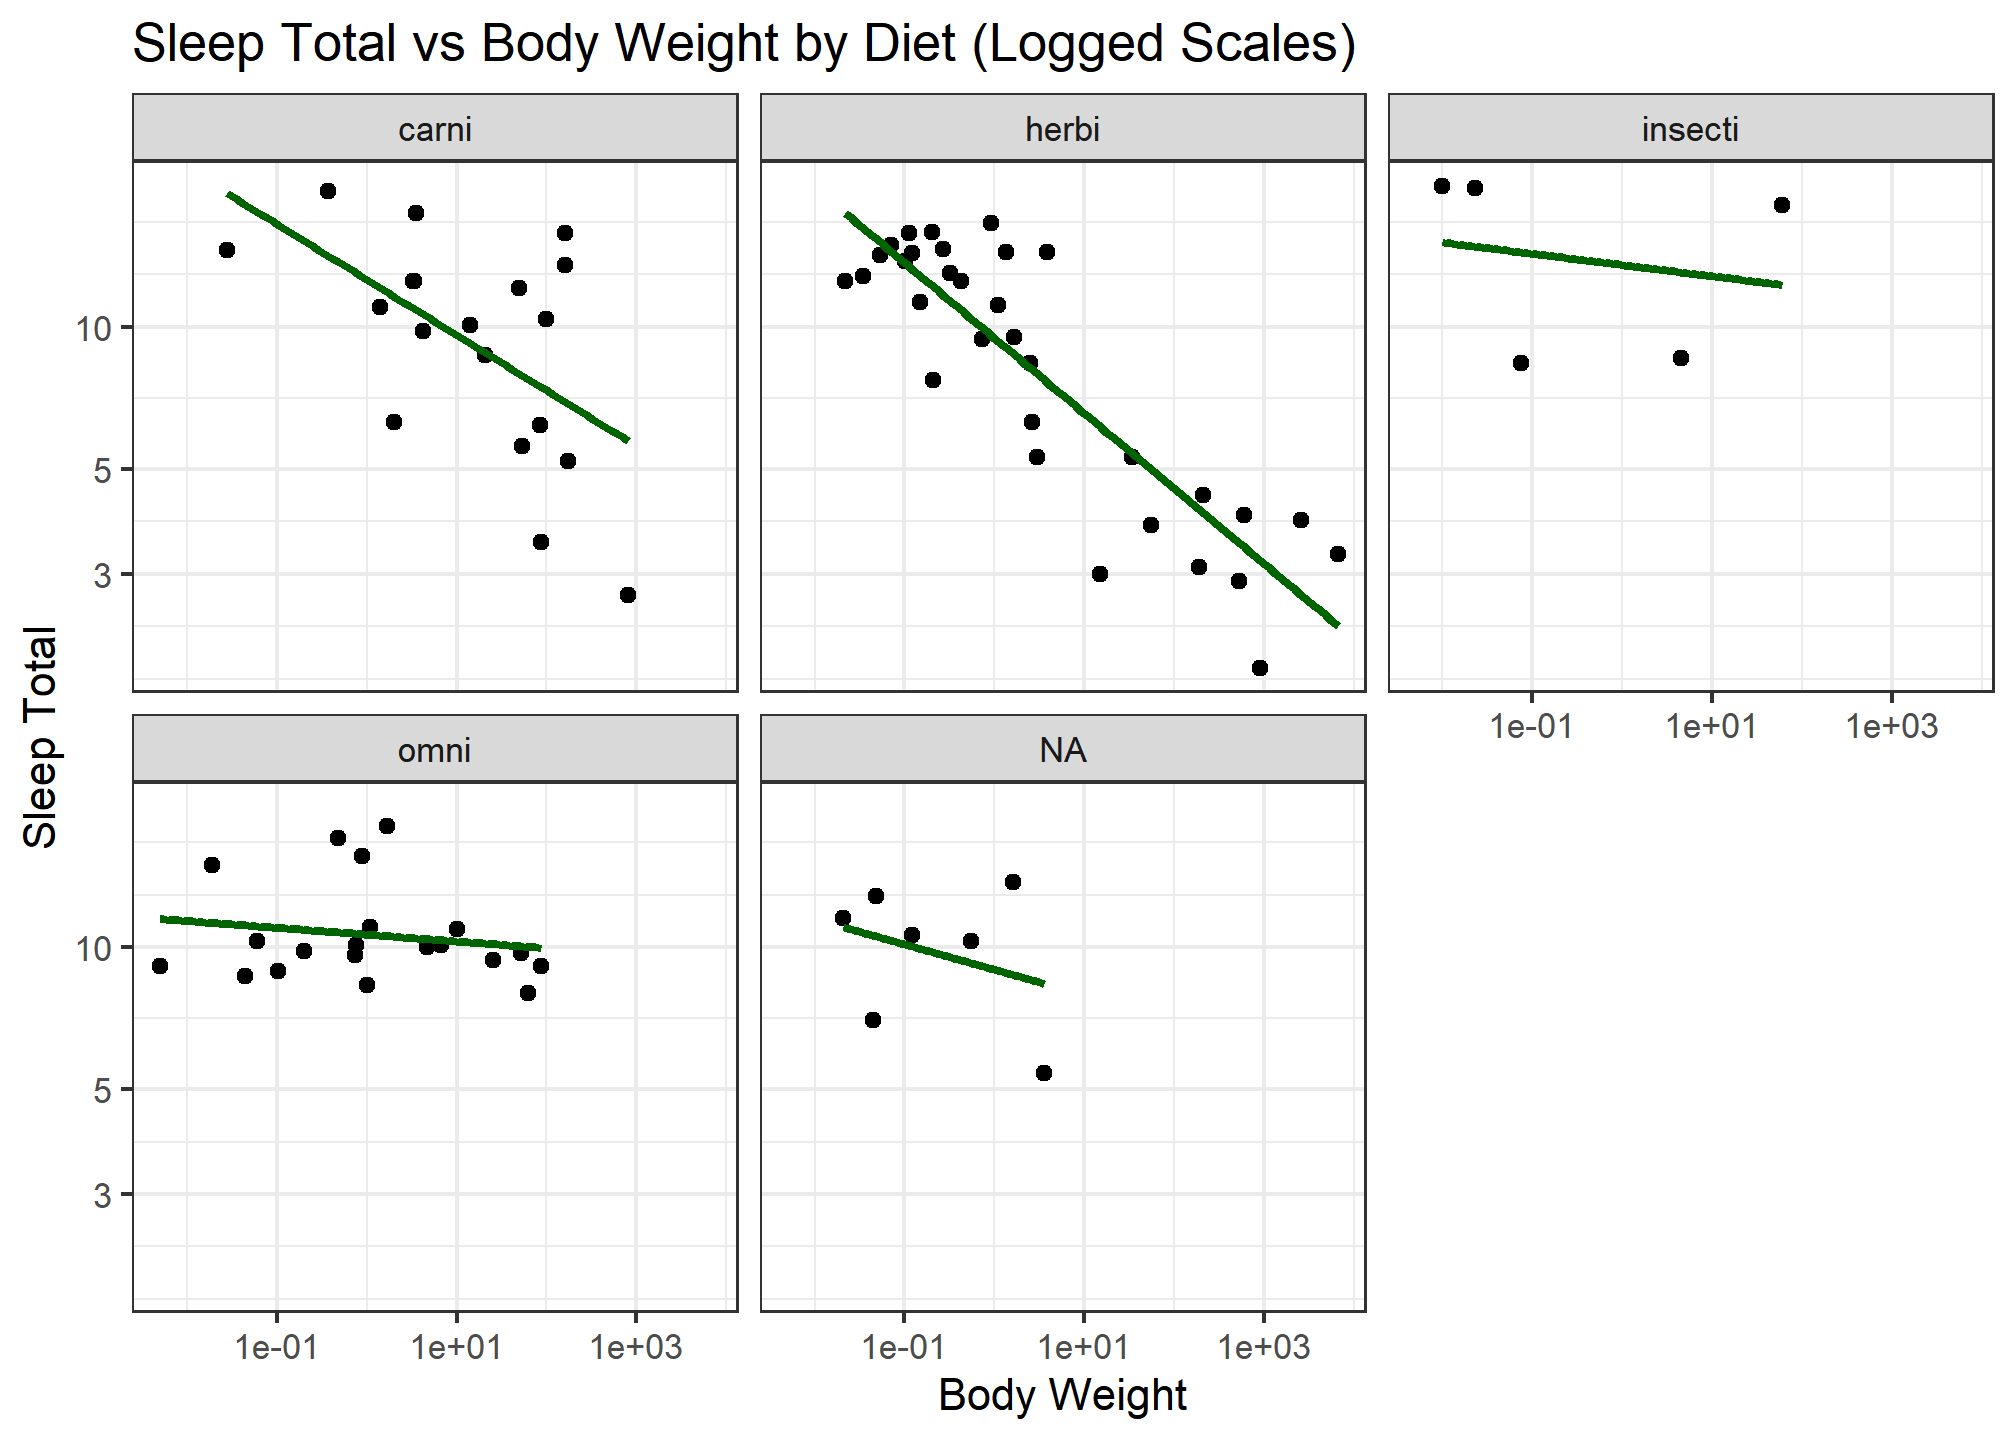
Note the following elements:
- the scale of the values of the x and y axes,
- the facets,
- the titles
- the color of the line (doesn’t have to be an exact match),
- the overall black and white theme
Extra Credit
Copy the plot from question 6 and add the overall (across all vore types) OLS line (without standard errors) to the plot.
- Make sure this new line is dashed, and has width of 0.5.
- Change the title of the legend to “Diet”.
- In one sentence, how does this line compare to the individual lines?