Lab 3
For this lab, complete part 1 and a at least one of the three following case studies. These are challenging but provide a real life example of what data wrangling looks like and I think each of you is capable of completing them!
Note: Each of these steps is separate from each other, you should start with the raw flights data each time.
Part 1: Practice
-
Install the
nycflights13package (using the console). It’s likely you already have this from the textbook reading. Load the tidyverse package and nycflights13 package and theflightsdata that comes with the package. -
Get a quick look at what your variables consist of and how many observations you have. Use
help(flights)to get a qualitative understanding of what each of these variables represents. -
Select all variables that include information about arrival or departure. Also keep the
year,month, andday. Use as few characters as possible in yourselect()call. Double check your work - did you grab something you didn’t actually want? -
Find the flights that satisfy all of the following conditions:
- Flew to Houston (IAH or HOU)
- Were operated by United, American, or Delta (UA, AA, or DL)
- Departed in summer (July, August, and September)
- Arrived more than fifteen minutes late, but didn’t leave late
- Remember you can break lines after commas for easier readability
- sort by the tail number in ascending order
How many rows did you end up with?
-
What is the minimum and maximum overall air_time? Your answer should be a dataframe with one row with two columns.
-
What airline has the highest and lowest average departure delay? Try using functions so that you only get one row for your highest function and one row for your lowest function.
- hint:
slice_*()is likely very useful here - explore the documentation! - if you want to just grab the airline of the highest,
pull()can also come in handy here.
- hint:
Part 2: Flight Cancellations Case Study
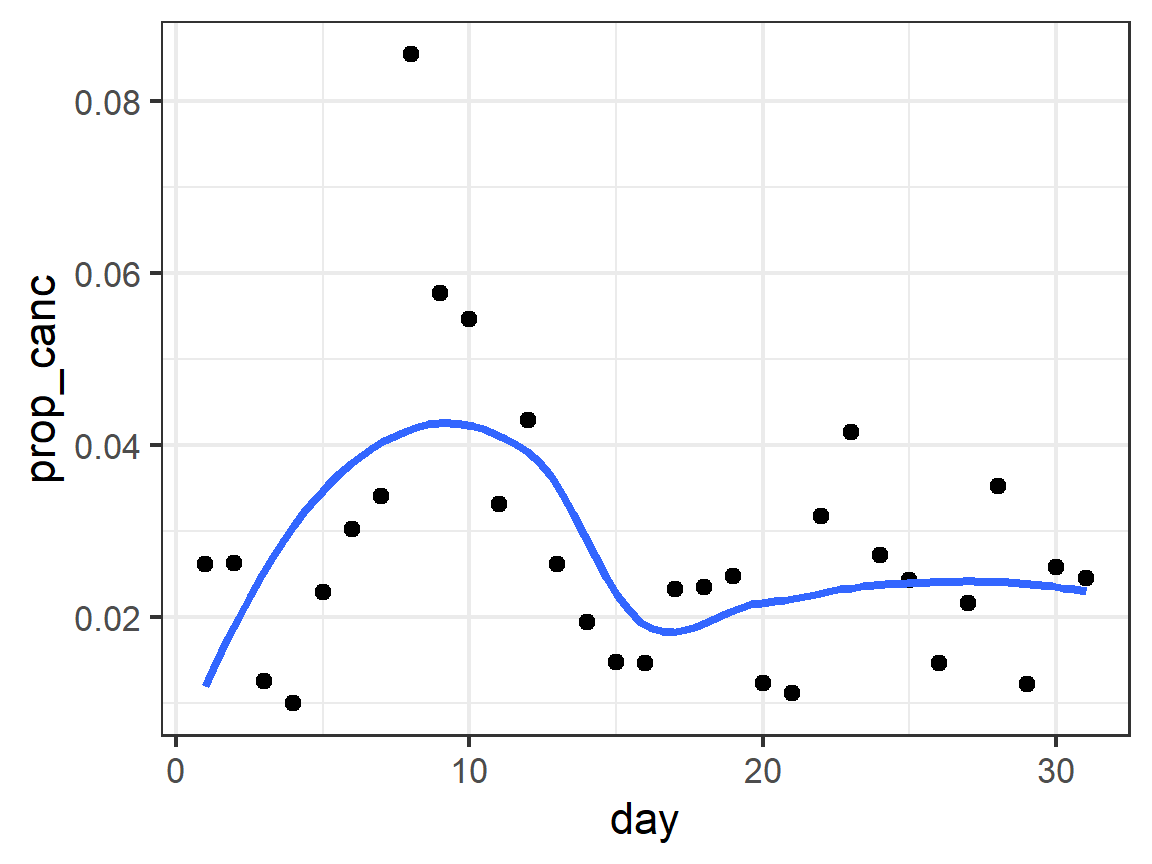
You work for the hypothetical “New York City department of airplanes”. They provide you with this dataset and you are asked to see if certain days of the month are more likely to have flight cancellations and perhaps why.
-
Plot the proportion of canceled flights per day of the month.
- You can tell a flight is canceled because the departure or arrival information is missing (hint:
is.na()). - If you create a “dummy” or “indicator” variable to indicate something is canceled, you can take the mean to calculate a proportion. (
mutate(is_cancelled = is.na(dep_delay) | is.na(arr_delay))) - See the following plot to help guide you if you get stuck.
- You can tell a flight is canceled because the departure or arrival information is missing (hint:
-
Does there seem to be a pattern?
-
Is the proportion of canceled flights related to the average daily delay?
Part 3: Tail Numbers Case Study
You are offered a contract to do some analysis for the Regional Airline Association. They want you to tell them which tail numbers have changed airlines. Can you accept this contract?
-
Find the number of unique tail numbers and the unique combinations of airlines and tail numbers. Does the unique number or tail numbers match the unique combinations of airline and tailnumber?
-
As shown above, there are more carrier-tail number combinations than unique tail numbers. There are two reasons for this: The presence of flights with no tail numbers and planes changing carriers. Find out which tail numbers belong to more than one carrier. Can you figure out how many tail numbers switched airlines but were not flights with missing tail numbers?
Part 4: Delay Outliers Case Study
Your new position as data science intern for the Committee of Disgruntled Airline Passengers has been quite rewarding. The Director of the committee has focused their attention on how flight delays create a major headache for passengers and has asked you to do some investigation on how often flights are “ridiculously delayed”.
- There is a rule of thumb for outliers that is often used: Anything 1.5 interquartile ranges (IQR) above or below Q1/Q3 is an outlier. (i.e.
\(outlier < Q_1 - 1.5IQR\)or\(outlier > Q_3 + 1.5IQR\)) Can you use this rule to only select the flights that are outliers based on the dep_delay variable? How many flights are considered to be outliers according to this rule?- remember that mutate adds a new column to all rows while summarize collapses the data into one row.
- to get the first and third quartile, use
quantile(x, 1/4)andquantile(x, 3/4)respectively.