HW 2: Wrangling
Instructions
- Download the .Rmd template used for this homework
here - After completing the questions, upload both the .RMD and .pdf OR .HTML files to Canvas.
- Use dplyr functions wherever possible.
Grading Rubric
| Question.Part: | Points | Topic |
|---|---|---|
| 1.1a | 1.00 | Loads packages and data |
| 1.1b | .50 | Variables |
| 1.1c | .50 | Observations |
| 1.2a | 1.00 | worst three planes |
| 1.2b | .50 | num flights |
| 1.2c | 1.50 | worst three with more than 12 |
| 1.3a | 1.50 | Correct data |
| 1.3b | 1.50 | Correct Plot |
| 1.3c | .50 | Correct Interpretation |
| 1.4a | 1.00 | Correct proportion of the total arrival delay |
| 1.4b | 1.00 | Correct worst flights |
| 1.5a | 1.00 | Finds correct destinations |
| 1.5b | 0.50 | selects only the destinations with max carriers |
| 2.1 | .50 | Loads packages and data |
| 2.2 | 1.00 | Missing gender |
| 2.3 | 1.00 | Update Droids |
| 2.4a | 0.50 | Correct medians and mean of height and mass |
| 2.4b | 0.50 | Uses Across |
| 2.5 | 1.00 | Correct BMI Update is saved to data frame |
| 2.6 | 1.00 | Correct Box Plots |
| 2.7 | 1.00 | Correct Scatter Plot with facets |
| 2.8 | 2.00 | Correct Plot |
| Total | 20.5 | Plus extra Credit |
The flights data frame from the nycflights13 package.
-
Load and review the data
- Load the tidyverse nycflights 13 packages
- Load the flights data frame
- What are the variables
- How many observations (rows) are there?
-
Worst Plane to Fly
- Which planes (
tailnum) have the three worst (highest) average departure delay record?- How many flights did each make?
- Now only look at the tailnums where each flew more than 12 flights and find the three tailnums with the highest average departure delay and show the tailnums with their average departure delay and number of flights.
-
Best Time of Day to Fly
-
Use a plot to see what hour of the day you should fly to minimize your expected (average) delay time. Which time is best?
-
Which time is best?
-
-
Worst Flight Numbers for each Destination
-
In a single series of steps, with no intermediate variables, complete the following steps in one set of piped code to produce a single output:
- For each destination, compute the total minutes of arrival delay, then use that result to:
- Compute for each trip (observation) to a destination its proportion of the total arrival delay for the destination; then use that result to
- Sort by destination, alphabetically, and from the highest to lowest proportion of total delay for each destination; then use that result to
- Choose for each trip, the destination, total arrival delay, flight number, proportion of the delay, number of trips, and the year, month, and day of departure; then use that result to
- Show the worst trip for each destination (where the delay is the maximum for the destination) with total arrival delay >= 0.
-
Extra Credit (1 pt), Repeat but instead of the worst trip for a destination,
-
Replace step 2 with Compute for each flight number to a destination. step 4, choose for each flight number, and step 5 Show the worst flight number …
-
-
Destinations with Multiple Carriers from NYC Area
- Find all destinations that are flown to by at least two carriers. Of these, show the destination airports that have the most carriers flying into them from any of the NYC airports. (hints:
distinct()orn_distinct()will help here, your final data frame will have 5 rows. )
- Find all destinations that are flown to by at least two carriers. Of these, show the destination airports that have the most carriers flying into them from any of the NYC airports. (hints:
Star Wars Characters
The starwars data frame in the dplyr package contains demographic characteristics of various characters from the hit franchise Star Wars.
-
Load the data into R and load any necessary packages
-
Use appropriate R code to determine which individuals have missing gender. Make sure to only print out their names and heights, arranged in ascending order of height.
-
Change their gender to
"droid"(even if they are not droids) and save to a new dataframe namedstarwars_clean. -
Use across to calculate the median and mean of both height and mass for each gender of
starwars_cleanshow the results. -
The body mass index (BMI) is defined as $$ BMI = \frac{\text{mass}{\text{kg}}}{\text{height}{m}^2} $$.
- That is, the BMI is the weight of the individual (in kg) divided by the height of the individual (in m) squared. There are 100 cm in each m.
- Calculate the BMI for each individual in the
starwarsdata frame and add it to thestarwars_cleandata frame. - Sanity check: The median BMI should be in the 20-30 range.
-
Make boxplots of gender vs BMI from
starwars_clean. Include only masculine, feminine, and droids. Use the black and white theme. -
Make scatterplots of height vs mass, faceting by gender.
-
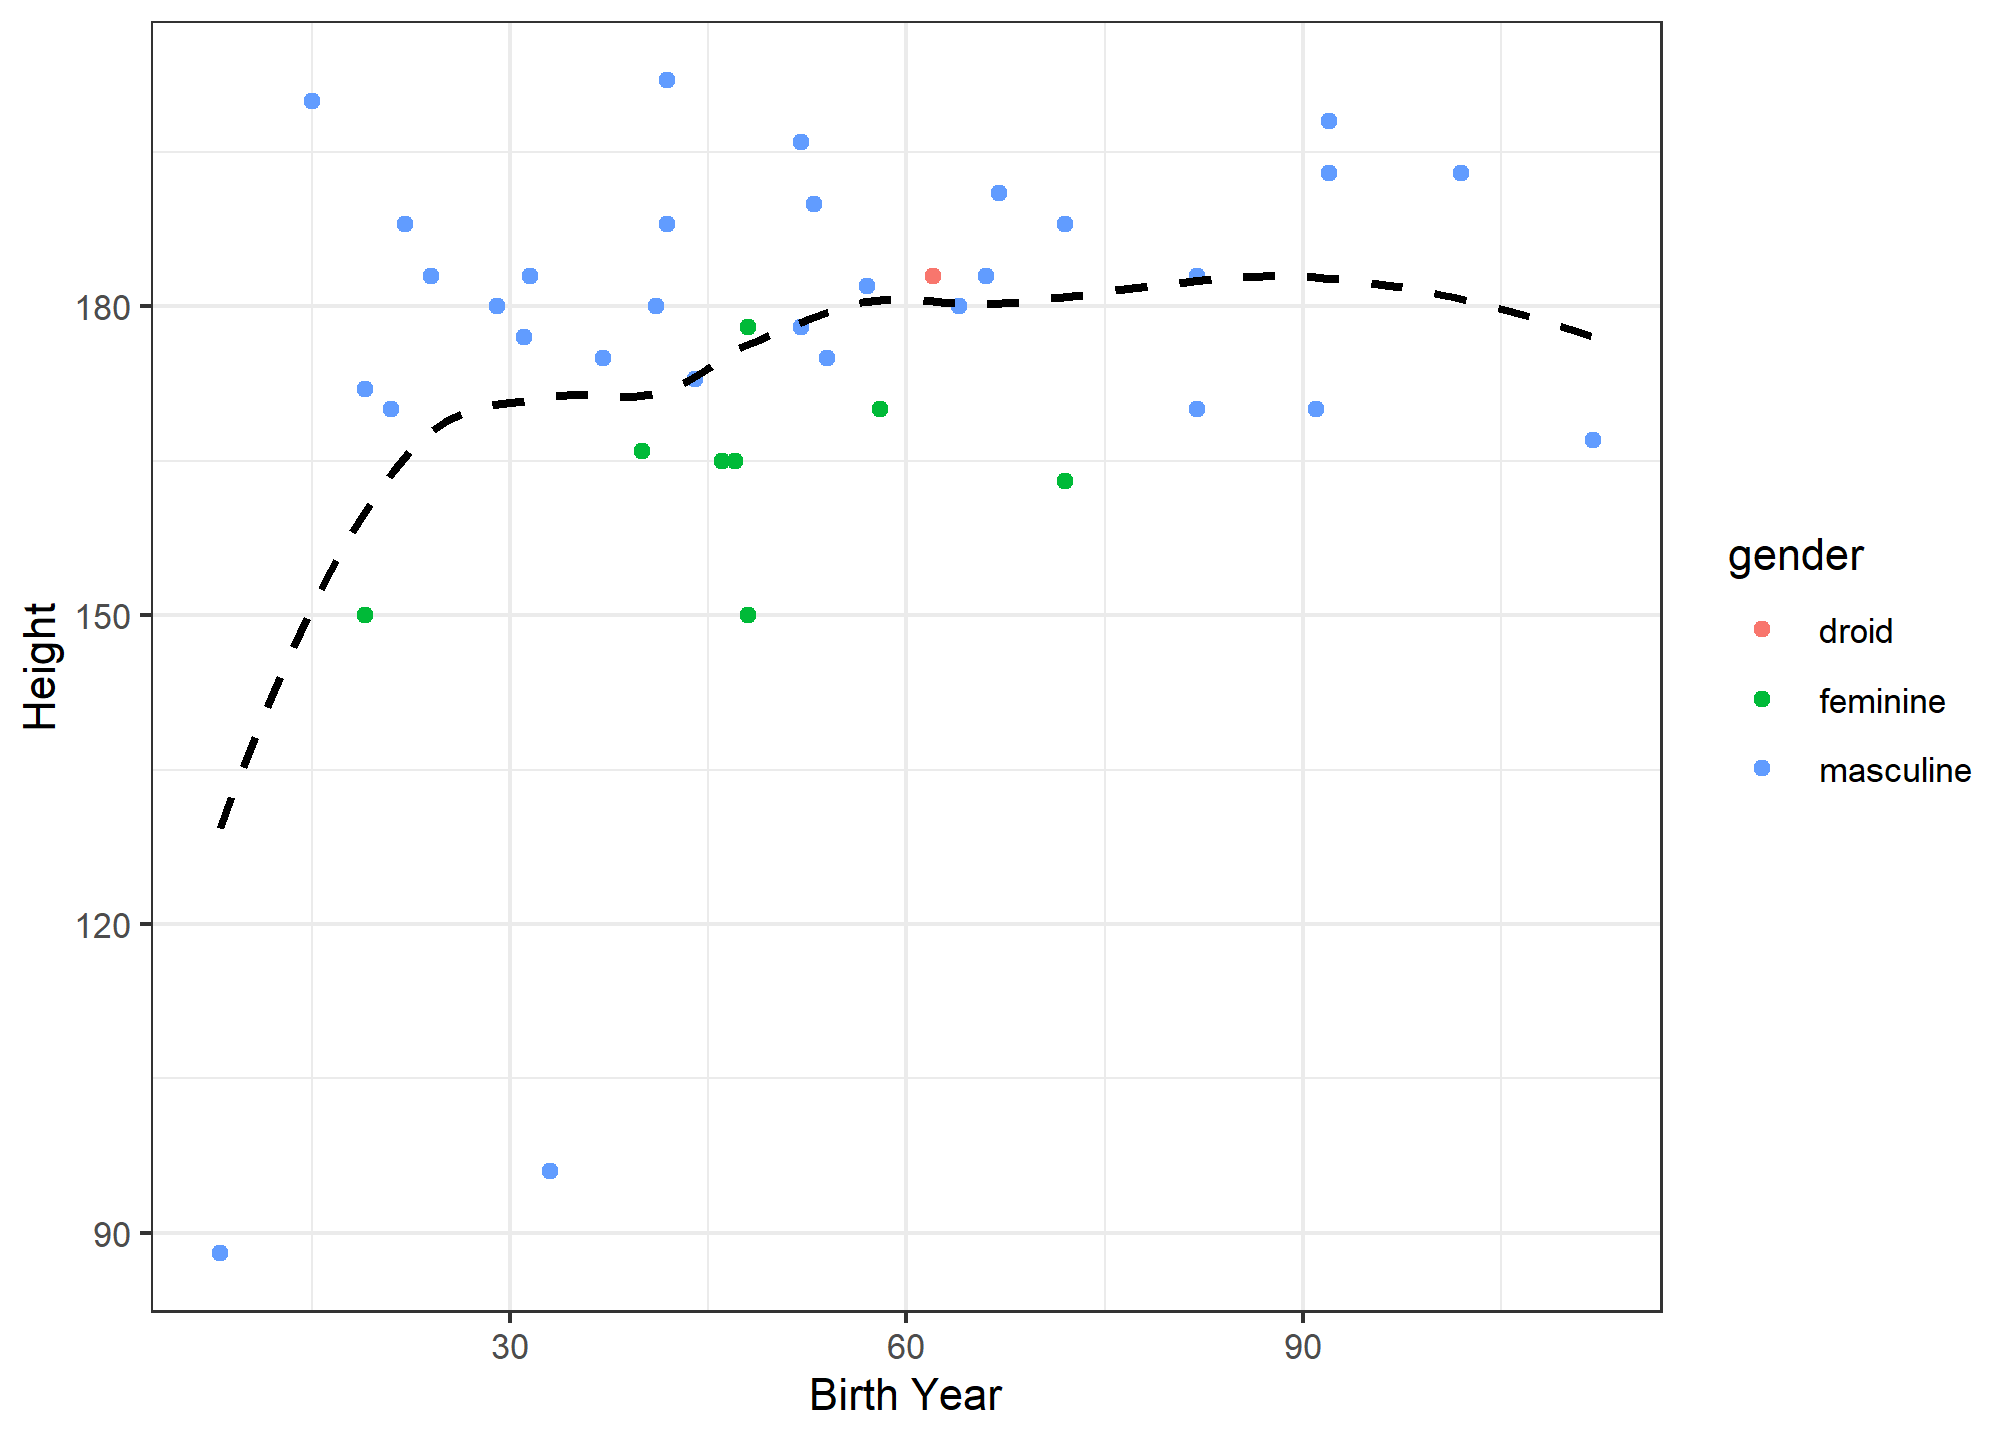
Reproduce the following plot (hint: filter based on birth year):