HW 4: Data Types
Due by 11:59 PM on Sunday, April 4, 2021
Instructions
- Download the .Rmd template used for this homework
here - After completing the questions, upload both the .RMD and .pdf OR .HTML files to Canvas.
- Use tidyverse functions wherever possible.
Grading Rubric
| Question.Part: | Points | Topic |
|---|---|---|
| 1.1 | 1 | Load data using correct function and a relative path |
| 1.2a | 1.5 | Fix 5 factors |
| 1.2b | 1.5 | Fix CrimeDate and CrimeTime |
| 1.3 | 1 | Fix variable names |
| 1.4 | 1 | Fix duplicate rows |
| 1.5a | 1 | Find unique levels |
| 1.5b | 1.5 | Correct forcats function |
| 1.6 | 1.5 | Correct lubridate extraction function |
| 1.7a | 1 | Correct ggplot aes() |
| 1.7b | 1 | Correct geom and arguments |
| 1.7c | 1 | Correct orientation and faceting |
| 1.7d | 1 | Reasonable explanation |
| 1.8a | 1.5 | Correct factor reordering |
| 1.8b | 1 | Production ready plot |
| 1.9a | 1 | Correct Filtering |
| 1.9b | 1.5 | Correct day of week extraction with labels |
| 1.9c | 1 | Correct order |
| Total | 20 |
Baltimore City Crime Data:
-
Download the Baltimore City Crime dataset:
baltimore_crime.csv. This data was originally available at this URL, but it has since been moved. Use a readr function to load the data. -
Review the data and fix variable types.
- Make sure you convert
CrimeCode,Description,Inside/Outside,Weapon, andDistricteach to factors,- You can change col_types in your
read_csv()function and / or usingmutate().
- You can change col_types in your
- Parse
CrimeDateandCrimeTimeinto date and time (or period) objects usinglubridatefunctions. - hint: There will be parse failure dialogue if you didn’t declare
quiet = TRUE. That’s okay.
- Make sure you convert
-
Fix non-standard variable names
- Use a “_” to replace the “/” or " " in the three non-standard variable names
- Show the new names of the dataframe columns
-
Fix duplicate rows
- Are there any duplicate rows?
- Remove them from the current data frame
-
Fix different codings for variables
- Find the unique levels for Inside_Outside.
- It appears there are two different coding systems in place.
- Use a
forcatsfunction to update the data frame to use a single coding system with the values Inside, Outside, andNA. - hint: there is more than one option here, but it may help to think about renaming or collapsing the levels
- Find the unique levels for Inside_Outside.
-
Find the hour of each crime
- From the
CrimeDateTimevariable, create a new variable calledCrimeHourwith the extracted hour that the crime occurred.
- From the
-
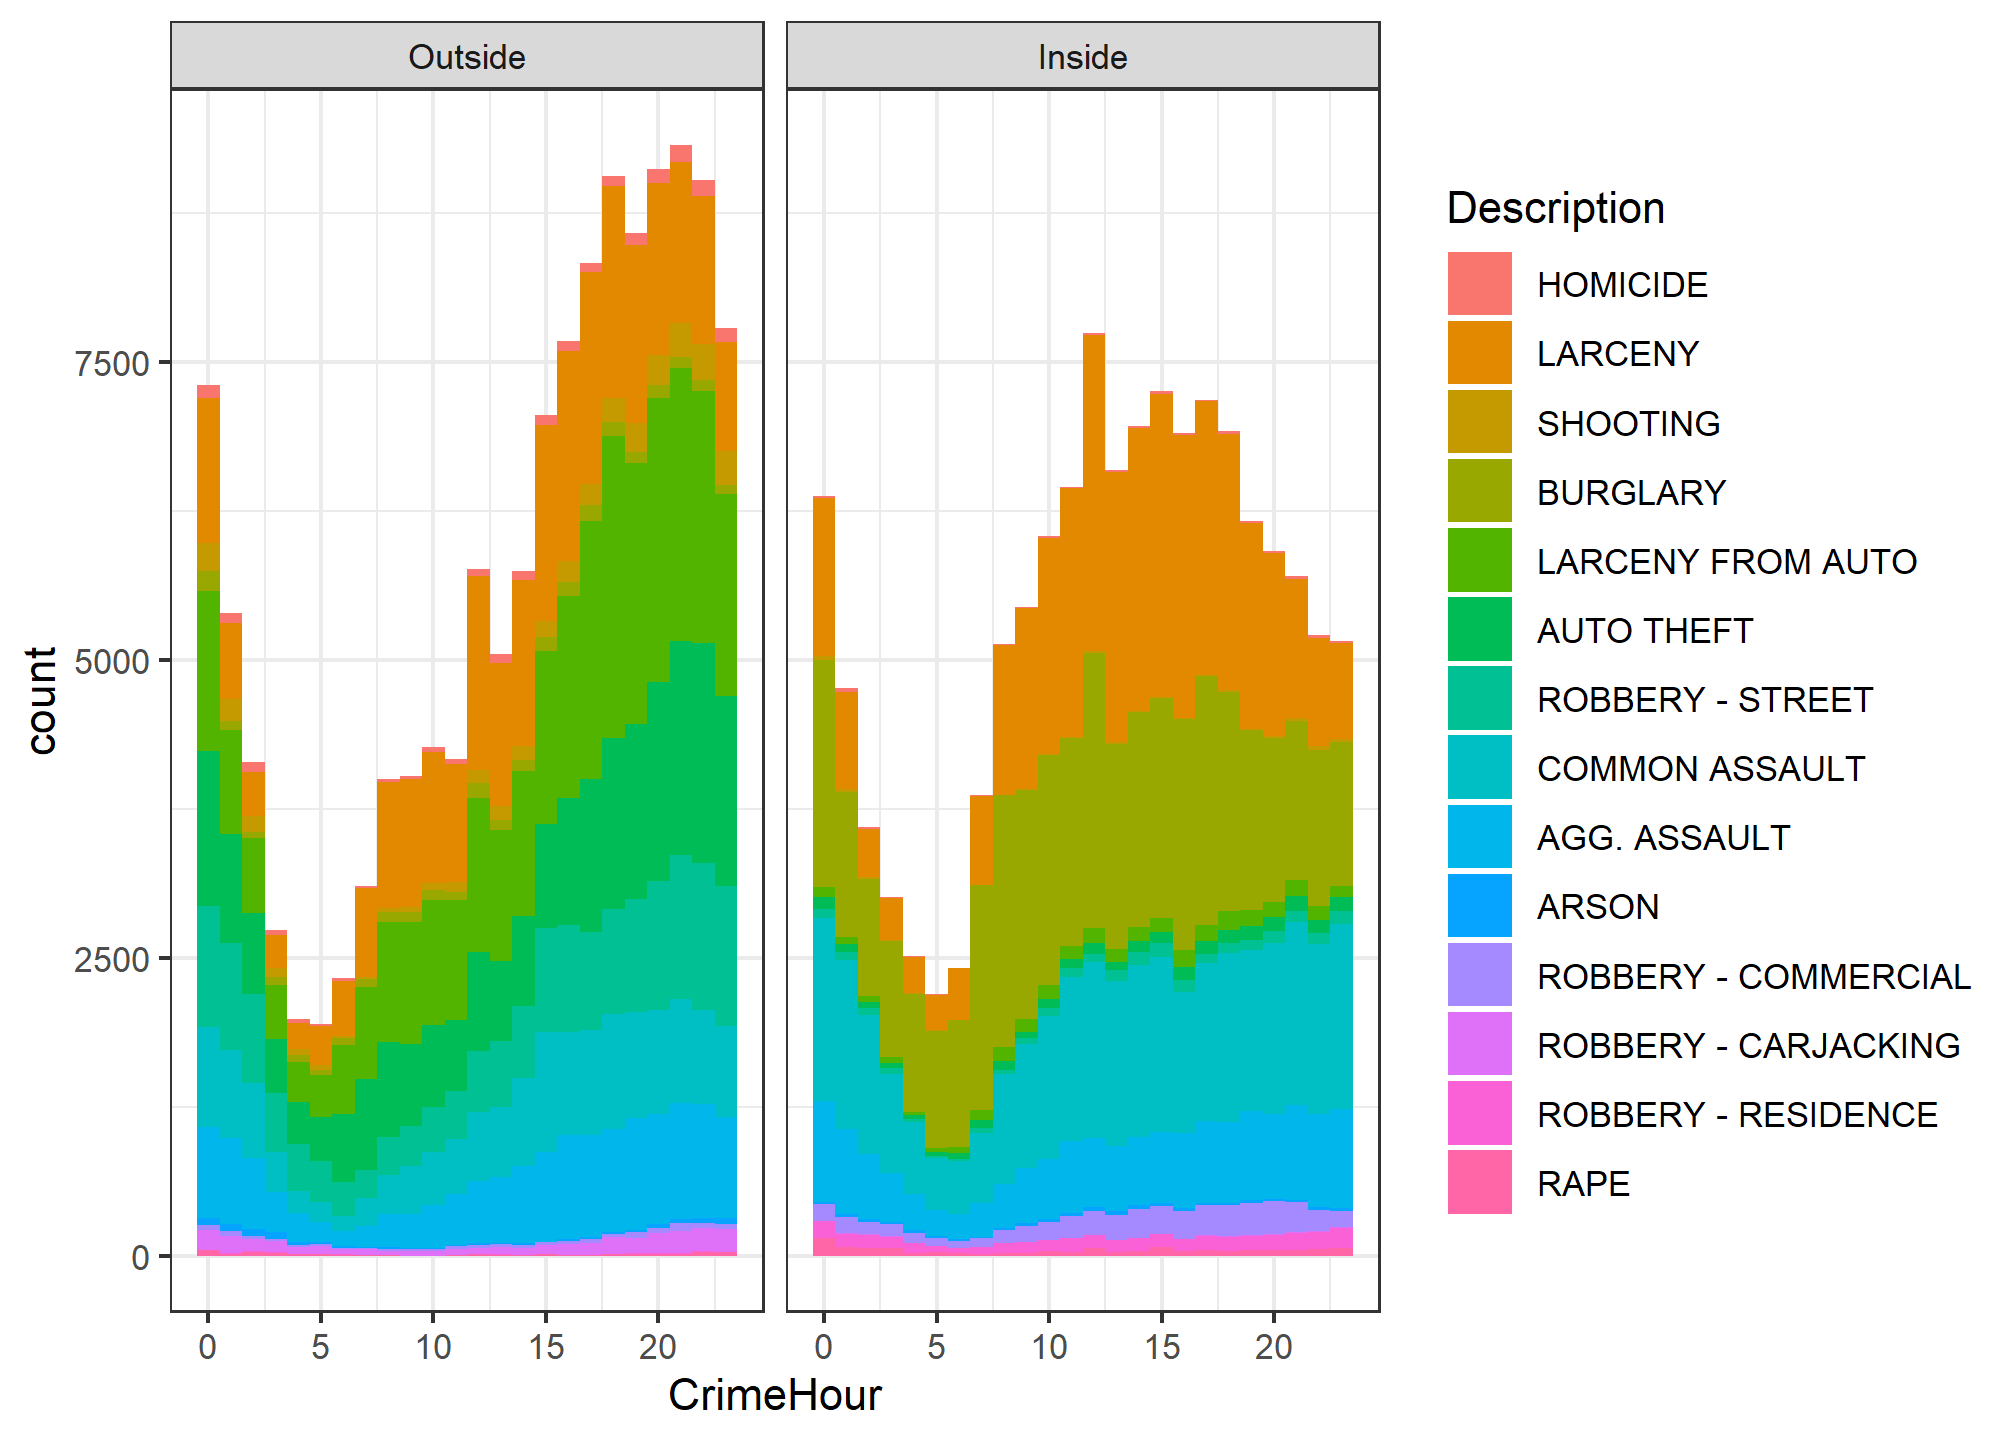
Reproduce the following plot. (hint:
geom_histogram())- By looking at it, which hour of the day has the most inside crime and which has the most outside crime.
- Think about how data might get entered and speculate on the cause for the mid-day spike
-
Reorder the
Descriptionvariable by total frequency of occurrence. Create a presentation-ready plot that shows the Description on one axis and the count of occurrences on the other axis. -
Which days of the week has the most homicides in Baltimore? list all 7 labeled days in descending order by count.